The Diagnostics and Performance Logging tool can be accessed in Microsoft Windows from Start -> Programs -> Strategy -> Tools -> Diagnostics Configuration, and on Unix from the mstrdiag command in the /bin folder.
To log the counters for the Strategy Intelligence Server 9.x process, the user must perform the following steps:
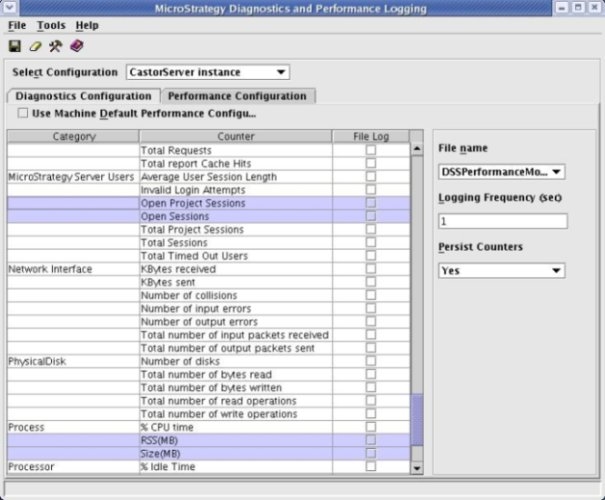
In Microsoft Windows and Unix, the Diagnostics and Performance Logging tool is the recommended interface to enable logging of the 'Strategy Server Jobs' and 'Strategy Server Users' counters in order to monitor the load on the server.
Additionally, using this interface on Unix, it is possible to log the memory related counters (Size (SZ) and Resident Set Size (RSS)) for the Strategy Intelligence Server process, as shown below:
NOTES:
The following knowledge base documents serve as useful references:
KB19155: Recommended performance logging counters to enable when troubleshooting memory or performance issues in Strategy Intelligence Server Universal 9.4.x - 10.x in UNIX/Linux environments
KB19154: Recommended performance logging counters to enable when troubleshooting memory or performance issues in Strategy Intelligence Server 9.4.x - 10.x in Microsoft Windows environments
For environments that do not have a GUI, a command line version of the Strategy Diagnostics Configuration tool can facilitate the collection of Performance Counters, as per the following Knowledge Base article:
KB46316: How to enable recommended performance counter logging for Strategy server instances from the command line using MSTRCTL command in Strategy Intelligence Server Universal 9.x - 10.x