EducationSoftwareStrategy.com
StrategyCommunity

Knowledge Base

Product

Community

Knowledge Base

TopicsBrowse ArticlesDeveloper Zone

Product

Download SoftwareProduct DocumentationSecurity Hub

Education

Tutorial VideosSolution GalleryEducation courses

Community

GuidelinesGrandmastersEvents
x_social-icon_white.svglinkedin_social-icon_white.svg
Strategy logoCommunity

© Strategy Inc. All Rights Reserved.

LegalTerms of UsePrivacy Policy
  1. Home
  2. Topics

KB13828: How to create a grid report showing Pareto (percentage) or cumulative percentages in MicroStrategy Developer 9.4.x - 10.x


Stefan Zepeda

Salesforce Solutions Architect • Strategy


This technical note lists the steps to create a grid report showing Pareto (percentage) or cumulative percentages in MicroStrategy Developer 9.4.x - 10.x

SYMPTOM:
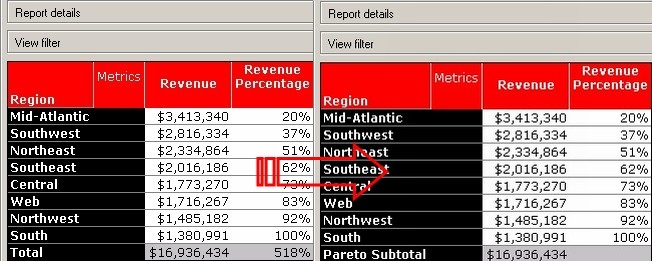
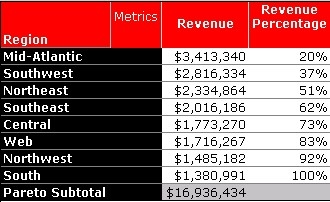
In Strategy Developer 9.4.x - 10.x, there is a graph called Pareto (Percentage). The idea is to see the contribution of each value leading to 100 percent, with the greatest contribution in the top and then descending in terms of relative importance contribution. Consider a simple report from the Strategy Tutorial project with the total Revenue per region, as shown below:
 

ka04W000001Ir4vQAC_0EM440000002FVB.jpeg

 
There is currently no function in Strategy Developer to allow this in a grid.
 
ACTION:
To create a Pareto grid like the one above, follow the steps below in the Strategy Tutorial project:
 

  • Create a report with Region on the rows and Revenue on the columns, as shown below:
ka04W000001Ir4vQAC_0EM440000002FV4.jpeg
  • Create a RunningSum metric on Revenue to use for creating the cumulative percentage later, as shown below:
ka04W000001Ir4vQAC_0EM440000002FV7.jpeg
  • To ensure that the report starts with the biggest contributors, change the parameters for the RunningSum by clicking on the function in the formula, selecting 'RunningSum parameters', and adding 'Revenue"=>"Descending' on the 'Sort By' page, as shown below:
ka04W000001Ir4vQAC_0EM440000002FV6.jpeg
  • To be able to create the cumulative percentage, divide this running sum by the grand total on each row. In order to do so, first create a total metric, as described in the two last screenshots of the following Strategy Knowledge Base technical note:
     
  • KB8813: How to create a Percent to Total metric without OLAP Services permissions in Microstrategy Desktop 8.x

 
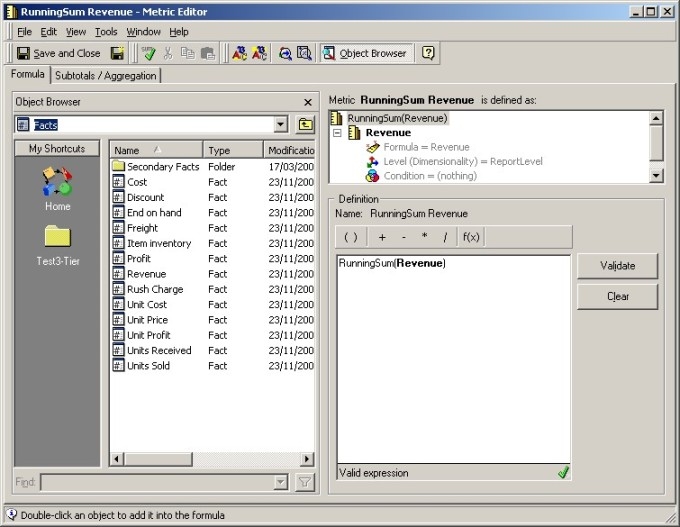
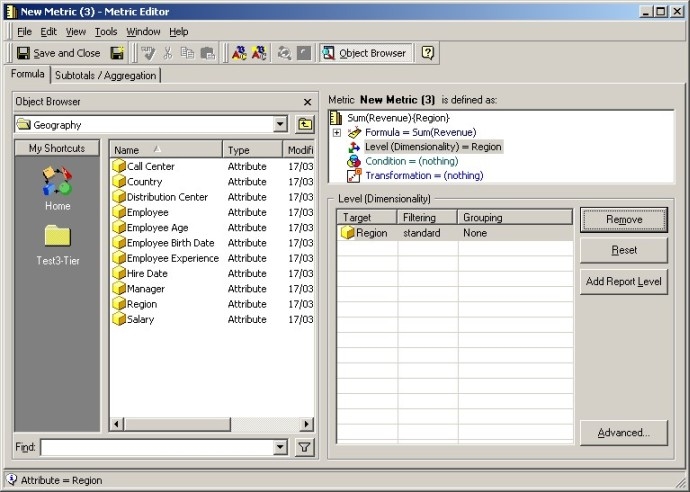
In this example, create the metric by using the Sum function over the Revenue metric. Then add Region, set 'Grouping' to 'None', and remove 'Report' in the Level (Dimensionality) section, as shown below:
 

ka04W000001Ir4vQAC_0EM440000002FVA.jpeg


  • Now create the Pareto Percentage by creating a new metric that divides RunningSum with this grand total metric, as shown below:
ka04W000001Ir4vQAC_0EM440000002FV9.jpeg
  • For clarity, put all the metrics on the report as shown below, and the correct sorting is done by selecting the percentage metric and clicking on the 'Ascending' Icon:
ka04W000001Ir4vQAC_0EM440000002FV8.jpeg
  • Now add a suitable total to get the desired look. As the percentage will be more than 100 because of the cumulative metric involved, create a subtotal and simply hide the percentage metric. Click on the total sign in the report, click Advanced, click New and set the percentage subtotal to '(None)'. Give the total a name and save it by clicking OK twice. Remember to check the Subtotal in the last window to make it appear on the report, as shown below:
ka04W000001Ir4vQAC_0EM440000002FV5.jpeg
ka04W000001Ir4vQAC_0EM440000002FV3.jpeg

Comment

0 comments

Details

Knowledge Article

Published:

April 26, 2017

Last Updated:

April 26, 2017