When using ODBC data sources, users can verify connectivity and test queries using the Strategy ODBC Test Tool. Against XML for Analysis (XMLA) data sources, a different tool must be used because the connection protocol is different.
Microsoft's distribution of the XML for Analysis 1.1 SDK includes a Sample application to illustrate how to use SDK functions. This application provides the basic functionality to connect to an XMLA data source and execute queries against it. This functionality can be invaluable when testing XMLA connectivity.
The XML for Analysis 1.1 SDK is available from Microsoft at the following location.
ttp://www.microsoft.com/Downloads/details.aspx?familyid=7564A3FD-4729-4B09-9EE7-5E71140186EE&displaylang=en
After installing the package, the source files for the sample application will be located at C:\Program Files\Microsoft XML For Analysis SDK\Samples\Sample. The project should be compiled using Visual Studio 6.0 according to the XML for Analysis 1.1 SDK online help.
Because XMLA is a standard protocol to interface with various database products, the Sample application discussed herein is not limited to use with Microsoft Analysis Services. It may be used to test connectivity to Hyperion Essbase as well.
Using the sample application
Launching the sample application presents a dialog box for basic connectivity information: the URL of the XMLA provider and the Data Source Information (DSI). The DSI is usually the machine name of the XMLA provider.
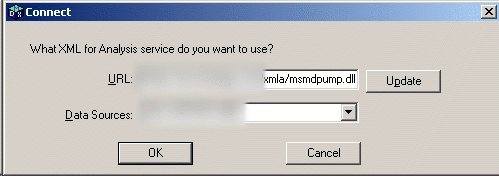
Note: The URL should include either the fully qualified machine name (i.e., machine.domain.company.com) or IP address.
Note: Users should enter the Data Source Information manually into the Data Sources field.
Note: Anonymous authentication is assumed. If the application server hosting the XMLA provider does not allow anonymous authentication, an authentication error may result.
The utility prompts the user to open a text file containing an MDX (multidimensional expression) query. If this dialog is canceled, an empty query editor will be presented.
In the main window, the correct Catalog and Cube may be chosen from the drop-down boxes at the top left. A query may be typed or pasted manually into the middle text area, and the query may be executed using the green play button.
The following illustration uses Microsoft's sample Adventure Works database in Microsoft Analysis Services.
When the query is executed, results should appear in the grid.

If an error occurs while connecting or trying to execute queries in the Sample application, the error is not presented to the user; instead, there will be no response in the interface. SOAP tracing using tcpTrace reveals the nature of the error. To configure tcpTrace, consult the following Strategy Technical Note.
Since the Sample application bypasses Strategy for connectivity, it is necessary only to substitute the tcpTrace machine and port when launching the Sample application. The error may be read in the FaultString node of the XML response.
WARNING:
The third-party product discussed in this technical note is manufactured by vendors independent of Strategy. Strategy makes no warranty, express, implied or otherwise, regarding this product, including its performance or reliability.
