SYMPTOM:
In Strategy Web 9.4.1 and above, percent bar graphs are not correctly displayed in Flash when the metrics have negative values.
If all the metrics in the percent bar graph have only non-negative values, or if the document is viewed in a different view mode (e.g. Interactive, Express, etc.), then the graph is correctly rendered.
STEP TO REPRODUCE:
1. In Strategy Tutorial project, create a report with Category attribute and Revenue metric.
2. In Strategy Web, create a new document and add the report as a dataset.
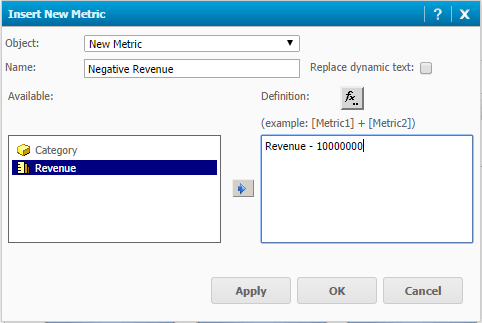
3. In the Dataset Objects pane, right-click on Revenue -> Insert New Metric. Define the formula as “Revenue - 10000000” and call the newly-created derived metric "Negative Revenue":
4. Add a new graph to the document containing "Category" attribute in the rows and "Negative Revenue" metric in the columns.
5. Switch to Editable mode, right-click on the graph -> Format. Set the following values:
- General -> Graph type: Vertical bar
- General -> Graph subtype: Percent
- Advanced -> Set series: By Row
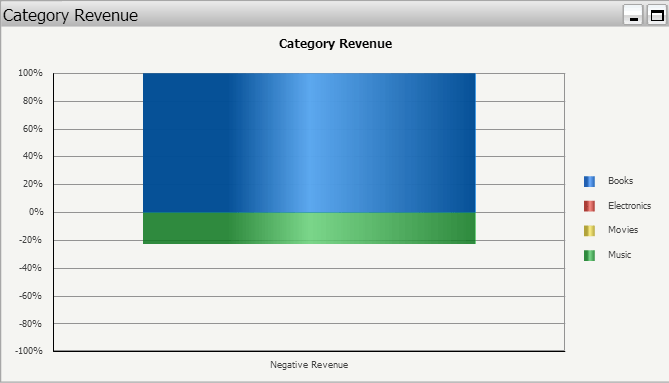
6. Switch to Flash mode. The graph is not correctly displayed:
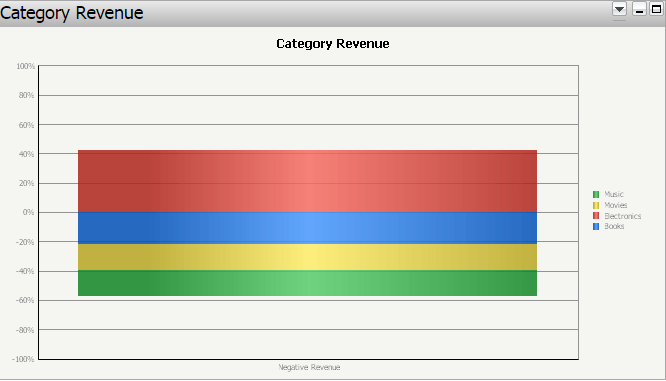
7. Switch to a different mode (e.g. Express). The graph is correctly displayed:
CAUSE:
This is a known issue with Strategy Web 9.4.1 and above.
ACTION:
This issue is not scoped for any upcoming scheduled Strategy release. The issue does not occur in Presentation Mode in the 10.x version and it is recommended to use other modes since Flash mode is being deprecated as explained in article KB257502: New in MicroStrategy 10.1 - Interactive and Flash document view modes deprecated.