EducationSoftwareStrategy.com
StrategyCommunity

Knowledge Base

Product

Community

Knowledge Base

TopicsBrowse ArticlesDeveloper Zone

Product

Download SoftwareProduct DocumentationSecurity Hub

Education

Tutorial VideosSolution GalleryEducation courses

Community

GuidelinesGrandmastersEvents
x_social-icon_white.svglinkedin_social-icon_white.svg
Strategy logoCommunity

© Strategy Inc. All Rights Reserved.

LegalTerms of UsePrivacy Policy
  1. Home
  2. Topics

KB219522: How to access the SQL view of a Visual insight Dashboard using an MCE Trace in MicroStrategy Web


Community Admin

• Strategy


How to access the SQL view of a Visual insight Dashboard using an MCE Trace in MicroStrategy Web.

SUMMARY
This document shows how to obtain the SQL Query information from a Visual Insight Dashboard. Currently, there is no SQL view in visual insight. The document provides steps and video information on how to obtain this information. These steps should work on most Visual Insight Dashboards in Strategy that have at least two datasets, but have not always been successful on dashboards based on multiple intelligent cubes.
 
DESCRIPTION
In a report or document, Strategy users have the option to access a SQL view so that they can see the behavior of the SQL engine during execution. This feature is not available when using Visual Insight dashboards. However, there is still a way for users to view back-end data in a Visual Insight dashboard.
 
NOTE: This only works on Visual Insight dashboards with at least 2 datasets.
 
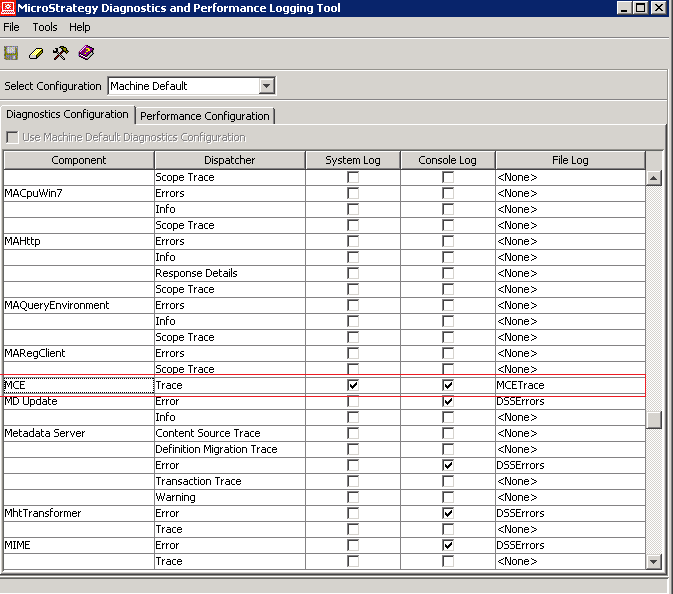
STEP 1: Enable the MCE trace.
 

ka04W00000148qVQAQ_0EM4400000025qZ.jpeg


  1. Open the Diagnostics and Performance Logging Tool from the Strategy Intelligence Server machine. 
  2. From the Select Configuration drop-down list, select Machine Default to configure logging for this machine only or for the entire server instance.
  3. Select the "Diagnostics Configuration" tab.
  4. Select the component "MCE".
  5. Select the "System Log" check box and the "Console Log" check box. 
  6. In the File Log drop-down list, select the log file you want the information logged into.
  7. From the File menu, select Save. The new settings are saved in the registry.

 
STEP 2
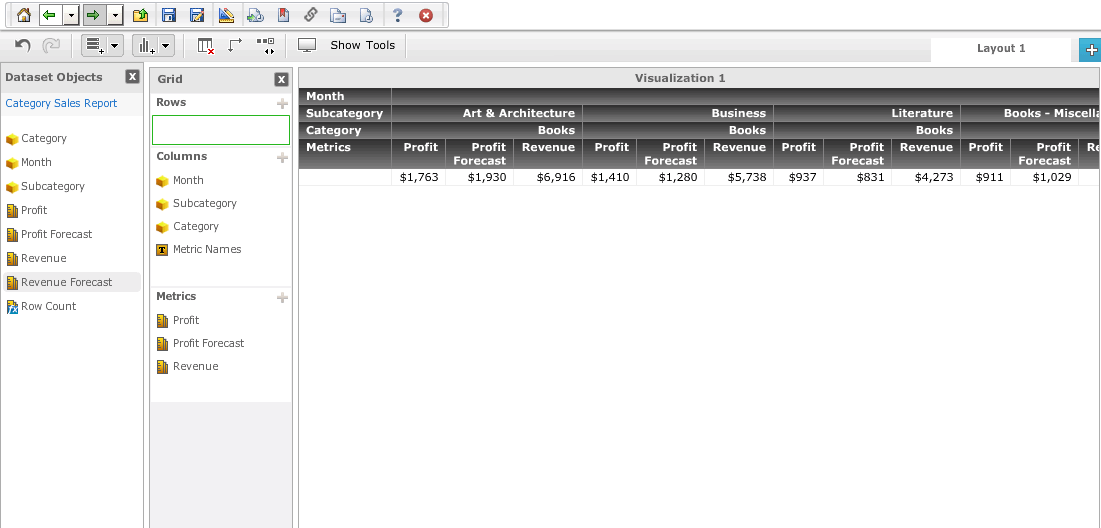
Run the dashboard as normal:
 

ka04W00000148qVQAQ_0EM4400000025qY.jpeg

 
STEP 3
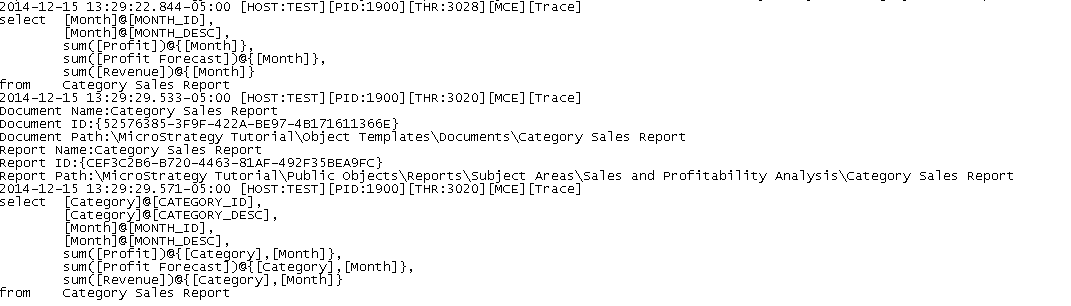
Retrieve the log from the specified location. It should look similar to this:

ka04W00000148qVQAQ_0EM4400000025qB.jpeg

 
ADDITIONAL TROUBLESHOOTING
If for some reason the MCE trace returns no information, check the following:

  • Use the CastorServer instance instead of the MachineDefault in the “Select Configuration” drop down.
  • Confirm that the MCE Trace is being logged to its own unique location. It will log into the DSSErrors.log by default.
  • Restart the Intelligence Server before running the dashboard.

 
If none of the above works, contact Strategy Support with the following information:

  • A screenshot of the VI Dashboard in Design Mode
  • A Screenshot of the Diagnostics and Configuration Tool on the Diagnostics Configuration tab.

 
Additonally, this procedure does not always work on dashboards that are based on multiple cubes. An enhancement request has been logged to increase the range of what the trace can do in such a situation.
 
TO LEARN MORE
The following tech notes provide more detailed information on the role of the MCE trace and Visual Insight Dashboards:
KB47740: How to enable MCE trace in MicroStrategy Analytical Platform
219522


Comment

0 comments

Details

Knowledge Article

Published:

July 10, 2018

Last Updated:

July 10, 2018