This technical note is part of How to troubleshoot Dashboard Performance document that can be found KB19625: Dashboard performance troubleshooting in MicroStrategy 9. .
To measure how long it took for a request to be completed we will measure the round trip time taken between the client machine and the Intelligence Server.
There are three main components when executing a Strategy Dashboard, the client machine, Web Server hosting Strategy Web and the Intelligence Server machine.

Using either the combination of Firefox and Firebug or Internet Explorer with Fiddler users can monitor the time it took to download the dashboard to the client.
If using Firebug, refer to the following Strategy Knowledge Base technical note for more information on this tool:
KB16585: How to install and use Firebug for MicroStrategy Web troubleshooting
If using Fiddler, refer to the following Strategy Knowledge Base technical note for more information on this tool:
KB17633: How to use Fiddler to retrieve data and definition XML from a Flash document in MicroStrategy Web 8.1.x., 9.x and 10.x
In this technical note we will discuss software and techniques to monitor the network time taken to fully fulfil a Report Services Dashboard request and also software that can be used to monitor traffic latency between the different components.
We’ll start with monitoring the time taken for a full request, round trip between client and Intelligence Server, this example uses a combination of Firefox and Firebug.
Using Firefox, execute a Report Services Dashboard.
After the rendering is complete, open firebug. The total time it took for the request to be completed is displayed at the bottom of the firebug log under the NET tab in bold with a gray background:
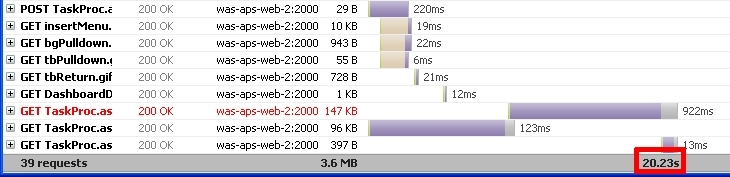
A Strategy Dashboard executed in Flash mode downloads first the HTML wrapper which contains the DashboardViewer.sfw file. The DashboardViewer.swf file makes subsequent calls to download the definition of the Dashboard, the data and flex settings. Each of those separate requests are captured by Firebug as calls to the GET TaskProc...
To differentiate the taskProc call to retrieve the Definition from the one that requests the binary data, expand the request and look at the Param tab. The Definition XML has a resultFlag=1024 or a tasked = docXMLResults. The Binary Data has a resultFlag=0 and a tasked = docBinaryResults.

Next to each of the request, there is the size of the file and the time it took to be downloaded, as shown below:

Network Performance
Two tools used by Strategy Technical support to measure Network performance between two given machines are:
The above two tools are very simple to use and are compatible with most operating systems.
