To configure performance counters on Windows Server 2008 R2/Server 2012/Vista/7 follow the steps below:
1. Open the Performance Monitor by going to Start > Run.... and running 'perfmon'.
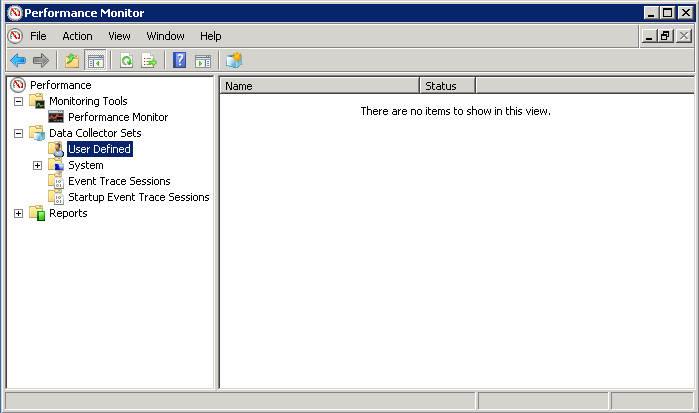
2. In the left-hand window pane, go to Data Collector Sets > User Defined, as shown below:
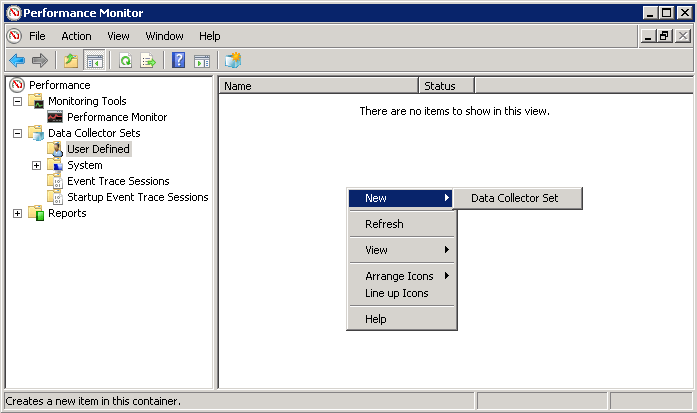
3. In the right-hand window, choose 'New... > Data Collector Set', as shown below:
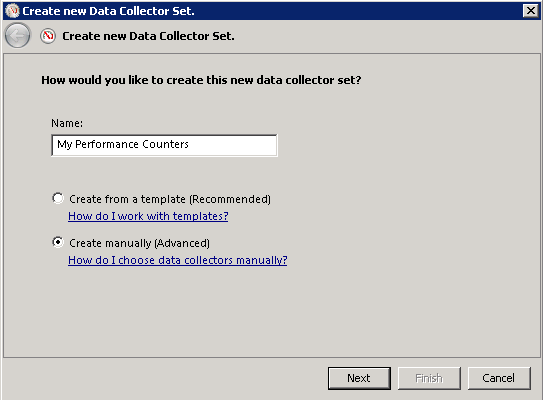
4. In the 'Create new Data Collector Set' wizard, enter the desired name for the set and select 'Create manually (Advanced)'. Click 'Next':
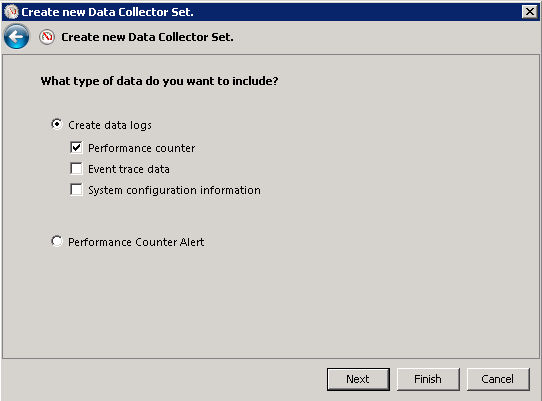
5. Select 'Create data logs' and check the 'Performance counter' option. Click 'Next':
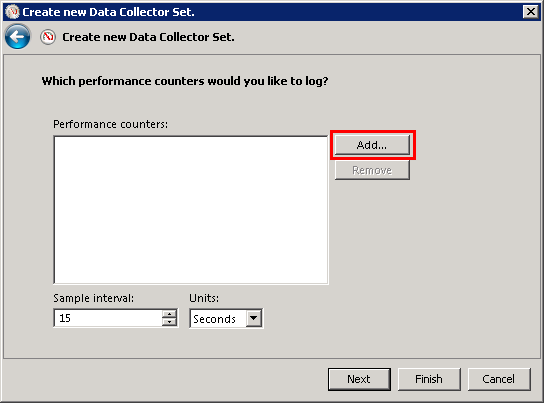
6. Click 'Add...' to bring up the Add Counter dialog:
7. Select the desired performance counters and click 'Add >>' to add them to the collector set. For suggestions on which performance counters to log, refer to the following Strategy Knowledge Base technical note:
KB19154: Recommended performance logging counters to enable when troubleshooting memory or performance issues in MicroStrategy Intelligence Server 9.x in Microsoft Windows environments
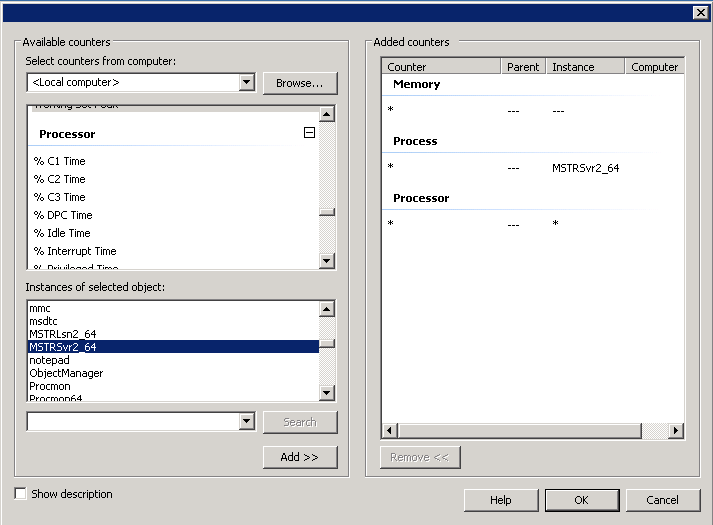
8. Click 'OK' when finished.
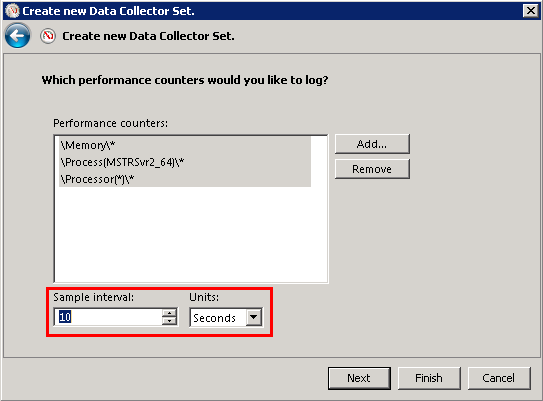
9. Specify the desired sample interval and click 'Next'. Strategy Technical Support generally suggests an interval of 10 seconds or less when gathering CPU or memory counters for troubleshooting:
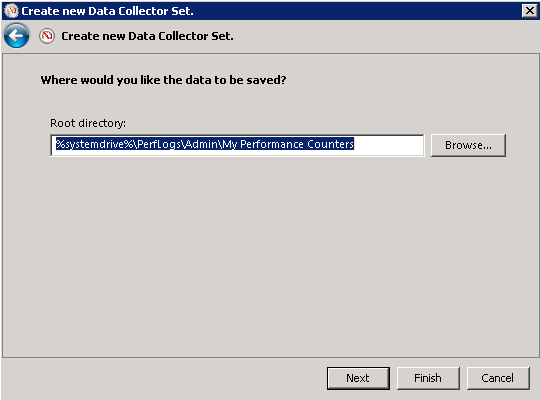
10. Specify the location to save the counter file. Click 'Next':
11. If desired, specify a user the data collector set should run as. If <Default> is used, the data collector set will run as the System user. For more information on the user requirements of data collector sets, refer to the following Microsoft TechNet article:
http://technet.microsoft.com/en-us/library/cc722414.aspx
Strategy Technical Support suggests keeping the user set to <Default>.
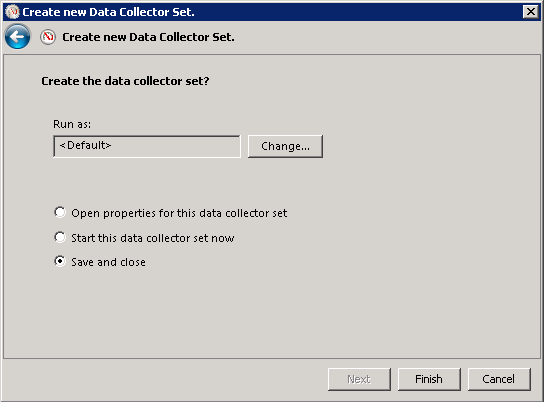
12. Select 'Start this data collector set now' or 'Save and close' and click Finish.
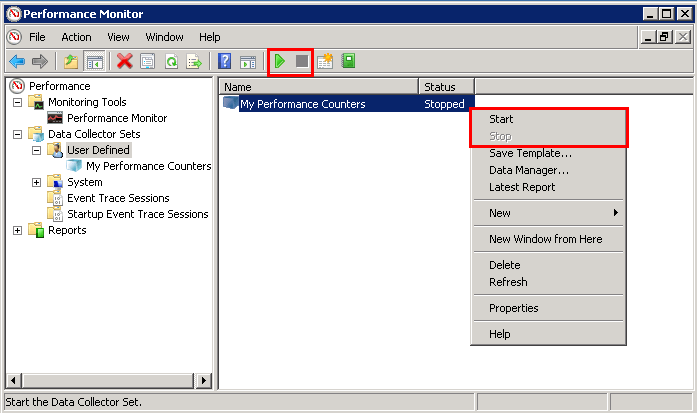
Once the data collector set is created, right-click on the set in the Performance Monitor interface and choose 'Start/Stop', or use the Play and Stop buttons in the Performance Monitor toolbar.