The Diagnostics Configuration tool is used to enable new traces that can be used for troubleshooting purposes and sent to Strategy Technical Support to be analyzed. The following steps describe using the Diagnostics Configuration tool in Windows, or GUI mode on unix systems.
For steps on modifying diagnostics through command line, refer to the following technical note:
KB15868: How to modify diagnostics logging for MicroStrategy components from the command line in Windows and Unix/Linux environments.
Open the Diagnostics Configuration tool by going to Start > Programs > Strategy > Tools folder on Windows, or run the mstrdiag command from the <Strategy_Home_Folder>/bin folder in Unix/Linux.
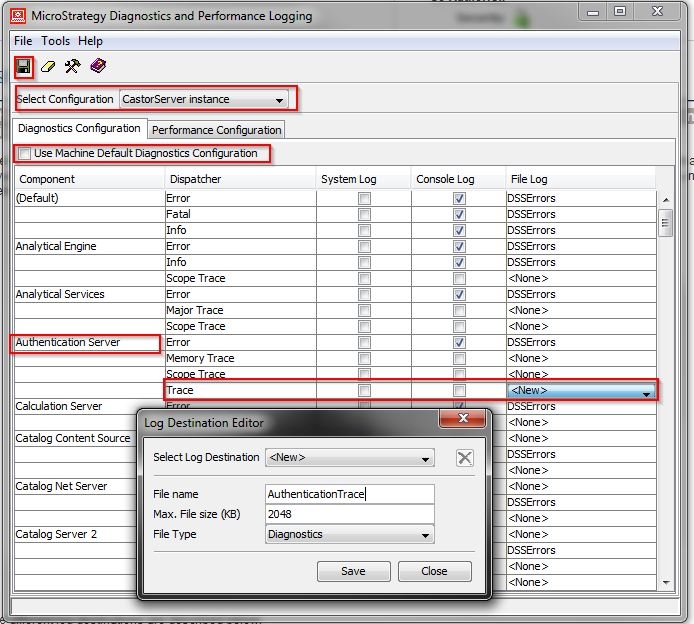
1. Select the "Configuration" dropdown and choose "CastorServer instance" or "Machine Default". An explanation of their differences is explained here:
KB13897: What is the difference between 'CastorServer Instance' and 'Machine Default' in Microstrategy Diagnostics 8.x and newer?
Generally, the CastorServer instance is used for most traces.
2. Uncheck the "Use Machine Default" setting
3. Search for the "Component" name of the trace, for example "Authentication Server".
4. Depending on the "Dispatcher" that needs to be logged, move to the "File Log" column and click on <None> and select <New>.
5. A popup window should appear called Log Destination Editor. Keep "Select Log Destination" as <New> and type in a file name.
6. Modify the file size as desired and keep the "File Type" as "Diagnostics". Click Save and close the popup window.
7. The newly named log should appear under the "File Log" column. Click "Save" on the main window.
8. System Log and Console Log do NOT need to be checked. For an explanation of their functions, refer to the following technical note:
KB33198: What are the different type of log destinations that can be enabled for specific logging dispatchers in the MicroStrategy Diagnostics Configuration 9.x
9. Most traces will need a server restart to take effect. Restart the Intelligence Server.
Newly created logs are located in the Common Files > Strategy > Log folder on Windows and the /log folder on Unix. After the troubleshooting is complete, remember to turn off unnecessary traces by changing the File Log to <None>.
Example of the Authentication Server Trace:
Refer to the following Strategy Knowledge Base technical notes related to the Diagnostics Configuration tool:
KB13313: How to enable logging of performance counters using the Diagnostics and Performance Logging tool for MicroStrategy Intelligence Server 8.1.x and 9.x in Microsoft Windows and Unix
KB18642: How to turn off diagnostics logging for MicroStrategy components from the command line in Windows and Unix/Linux environments