EducationSoftwareStrategy.com
StrategyCommunity

Knowledge Base

Product

Community

Knowledge Base

TopicsBrowse ArticlesDeveloper Zone

Product

Download SoftwareProduct DocumentationSecurity Hub

Education

Tutorial VideosSolution GalleryEducation courses

Community

GuidelinesGrandmastersEvents
x_social-icon_white.svglinkedin_social-icon_white.svg
Strategy logoCommunity

© Strategy Inc. All Rights Reserved.

LegalTerms of UsePrivacy Policy
  1. Home
  2. Topics

KB484788: How to create transformation metrics using data wrangling when importing data


Laurent Lee A Sioe

Director, Sales Engineering • MicroStrategy


This article provides steps for creating transformation metrics using data wrangling during data import.

Starting with the release of Strategy ONE (March 2024), dossiers are also known as dashboards.

Description


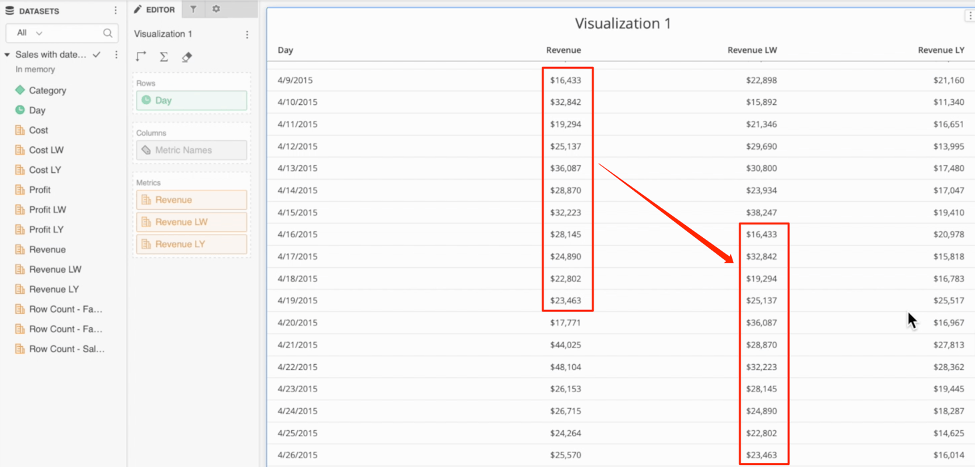
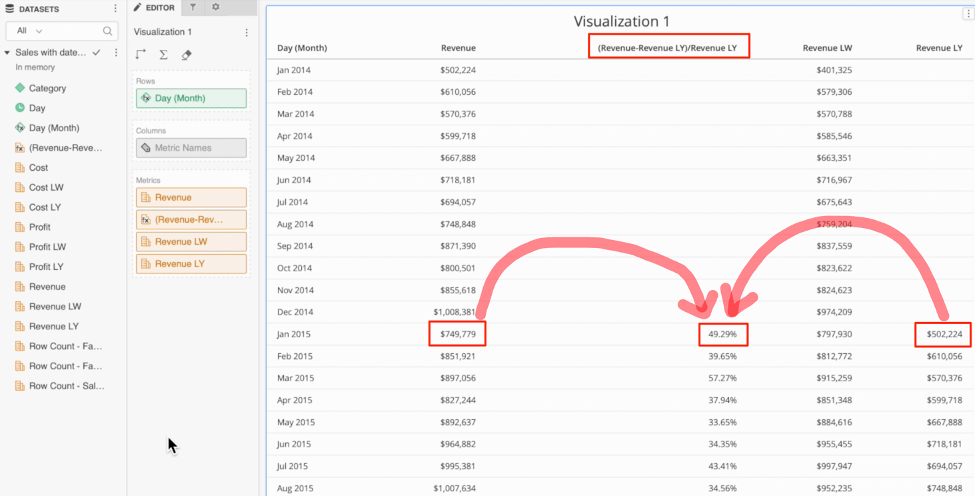
Transformation metrics are useful for calculating metric values for different time periods (e.g., Last Year, Last Month, and Last Week).
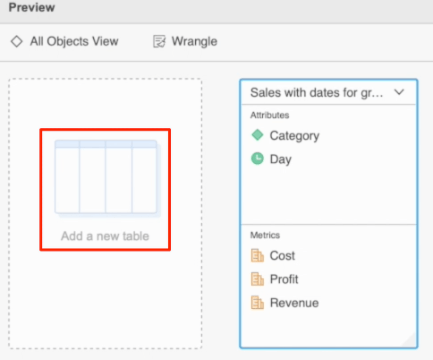
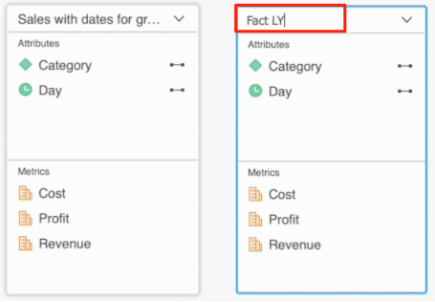
When importing data, the transformation objects are not available. However, it is possible to replicate the same behavior of a transformation object using data wrangling.
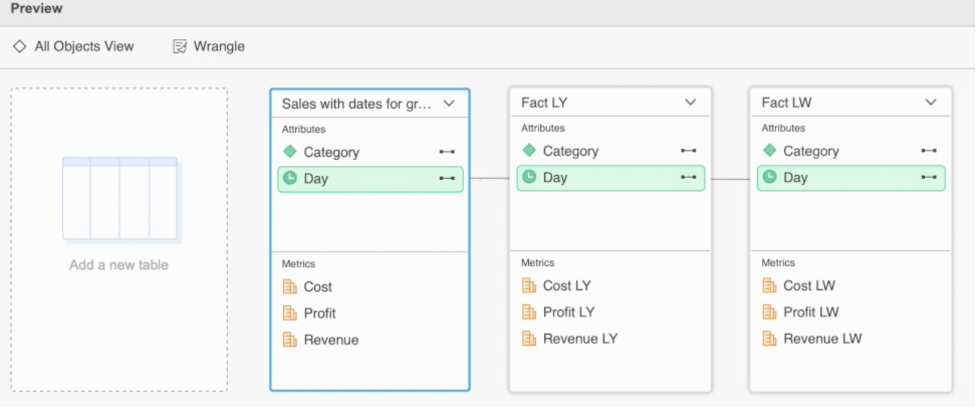
Here is the general principle:

  • Import your table with a date attribute. You get all the attributes and metrics as usual.
  • Re-import your table again in the same MTDI cube.
  • Wrangle the new table to
    • Change the metric names (e.g., append “_LY”).
    • Modify the date to add 1 year (as to simulate the Last Year value).
  • Save and create a dossier.
  • You should have Day and your metrics (e.g., Revenue, Revenue_LY) so that you can do all the necessary calculations.


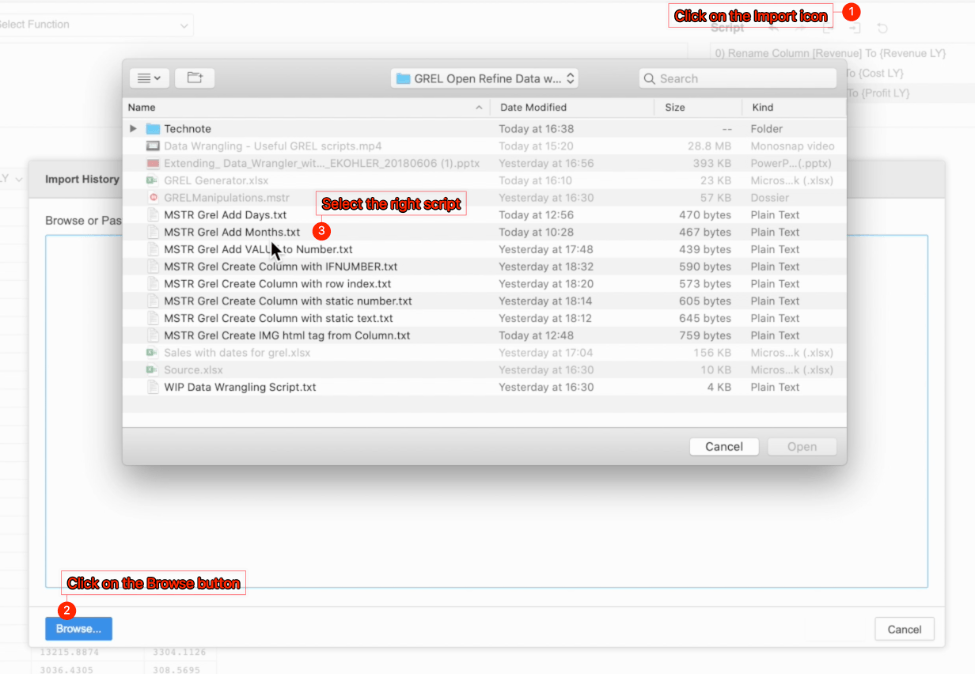
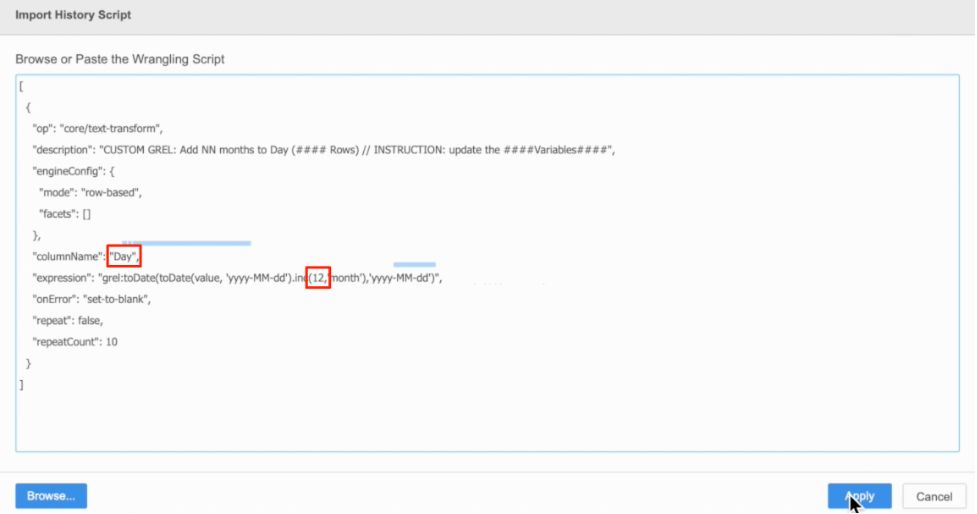
The “add 1 year” step is not something that is directly available out of the box. However, it can be achieved by importing the correct script in the wrangling interface.
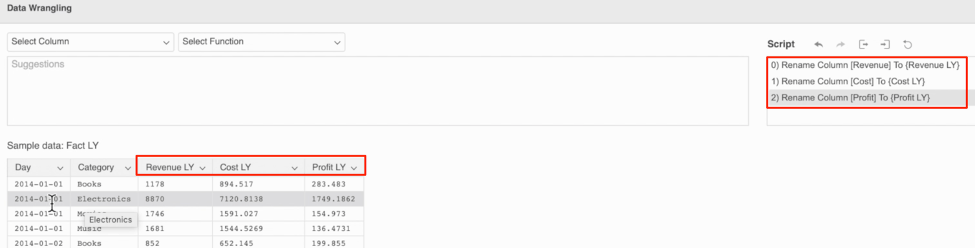
The following are a few example scripts:

  • Add Months to a date
  • Add Days to a date
  • Add Value to a number
  • Create a new column with static text
  • Create a new column with static number
  • Create a new column with row index
  • Create a new column to have the HTML image tag from a column having the file name
  • Create a column with simple IF test


The Data Wrangling engine is based on GREL Open Refine. For more information on generating scripts, see KB484386: Data wrangling using GREL generator.

Steps for creating transformation metrics

  • Import your file containing a date attribute.
  • Click on the Add new table icon. Re-import the same table.
ka0PW0000002MXVYA2_0EM4W000001KFYn.jpeg
  • Change the name of the new table to a meaningful name, e.g., Fact LY.
ka0PW0000002MXVYA2_0EM4W000001KFYs.jpeg
  • Click on the Wrangle button.
  • Modify the names of the metrics to meaningful names, e.g., Revenue LY.
ka0PW0000002MXVYA2_0EM4W000001KFYx.jpeg
  • Import the correct script, e.g, MSTR Grel Add Month.txt.
ka0PW0000002MXVYA2_0EM4W000001KFZ2.jpeg
  • Modify the script to match you data. Update the columnName for the date and change the value to 12 months.
ka0PW0000002MXVYA2_0EM4W000001KFZ7.jpeg
  • Click Apply.
  • Perform the same steps above if you need other periods, e.g., Last Week or Last Month.
ka0PW0000002MXVYA2_0EM4W000001KFZC.jpeg
  • Go and create a dossier. You can easily manipulate the different metrics or create calculations.
ka0PW0000002MXVYA2_0EM4W000001KFZH.jpeg
ka0PW0000002MXVYA2_0EM4W000001KFZM.jpeg


Comment

0 comments

Details

Knowledge Article

Published:

December 26, 2020

Last Updated:

June 5, 2024