EducationSoftwareStrategy.com
StrategyCommunity

Knowledge Base

Product

Community

Knowledge Base

TopicsBrowse ArticlesDeveloper Zone

Product

Download SoftwareProduct DocumentationSecurity Hub

Education

Tutorial VideosSolution GalleryEducation courses

Community

GuidelinesGrandmastersEvents
x_social-icon_white.svglinkedin_social-icon_white.svg
Strategy logoCommunity

© Strategy Inc. All Rights Reserved.

LegalTerms of UsePrivacy Policy
  1. Home
  2. Topics

KB439628: How to use Advanced Thresholds to Set Series’ Color on Graphs in MicroStrategy Web 10.4+


Caitlin Corrigan

Senior Education Developer • Strategy


This article describes how to set a specific color for an attribute or metric series on a graph by using a threshold in MicroStrategy 10.4 and higher.

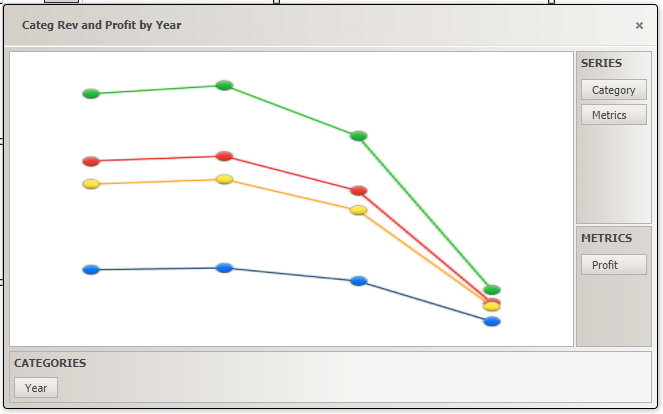
When running a Report Services Document with a graph, users may want to assign a specific color for a series on a graph.  If users set the color for a series using the graph' s Properties and Formatting window, the color is assigned based on an index and will change if an attribute element or metric is removed from the graph or deselected from a selector.  This is described in KB37102 and KB42371. In Strategy 10.4 and higher, users can use advanced thresholds to set the color for the series on the graph as described below.
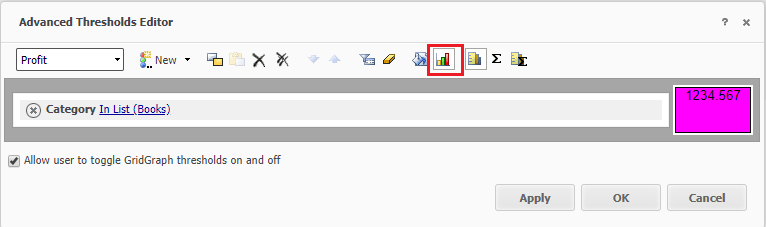
Follow the steps below using Strategy Tutorial in Strategy Web to set a specific color for a series on a graph:

  1. Create a new report with Year, Profit, and Category and save.
  2. Create a new document and use the report created in Step 1 as the data set.
  3. Insert a line graph in the document.
  4. In the Graph Zones, add Year to the Categories section, Profit to the Metrics section, and Category to the Series section.  “Metrics” should be added to the Series by default.  Each line will now represent that Profit for each Category.

​

ka02R000000kV6LQAU_0EM44000000YREd.png
  1. Select from the main menu Data >> Thresholds >> Advanced.
  2. In the Threshold Editor, select Profit in the drop-down and create a threshold for the Category, such as “Category In List (Books)”.
  3. Click the paint bucket icon and then go to the Colors and Lines tab.
  4. Select the desired color for the Books line in the Fill section and select OK.
  5. While still in the Advanced Thresholds Editor, click the graph icon to Enable Thresholds on Graph.

​

ka02R000000kV6LQAU_0EM44000000YREi.png
  1. Create a threshold for each attribute element of Category. Select OK to apply the thresholds and close the Advanced Thresholds Editor.  The thresholds will now be applied to the graph.

​

ka02R000000kV6LQAU_0EM44000000YREn.png
  1. When Books is deselected (or any other element on the graph with a threshold), the color for the other Series on the graph will not change like when the color is set through the graph’s Properties and Formatting window.


ka02R000000kV6LQAU_0EM44000000YREs.png


KB439628


Comment

0 comments

Details

Knowledge Article

Published:

February 8, 2018

Last Updated:

November 14, 2018