Circumstances exist where the same report may yield different results depending on the order of intermediate tables in the final pass such as when:
These circumstances are the result of some properties of full outer join operations:
Note: One-sided outer joins (left outer join, right outer join) are not commutative.
Thus, when inner joins are used, the order of intermediate tables does not matter to the final result. Similarly, when there are only two metrics on the report, there is only one full outer join and the order does not matter. When one metric is set to inner join and the other to outer, the table for the outer-joined metric is the driving table and the other tables are the deficient table(s). In this case, the Strategy SQL Generation Engine will place the driving table first and perform a left outer join against the deficient table(s).
When using the "Do not do downward outer join" setting, it is assumed that there will be situations in which the Strategy SQL Generation Engine will not be able to resolve conflicts between different possible orderings of metrics in the final pass. Strategy allows report designers to control the ordering, and thus the final result, by placing metrics on the template.
Note: There is an additional "Do not do downward outer join" setting that automatically orders the metrics based on dimensionality. When using this setting, dimensionality order overrides template order. However, Strategy cannot guarantee an optimal ordering of tables unless there is at least one report level metric. The technique described in this document is especially relevant, then, when a report contains no report level metrics, or when the user desires additional control over metric ordering.
There is one exception to the rule that template order determines final pass join order. The SQL Engine will try to place first in the join path the first report level metric it finds on the template (if one is available). It does not search for additional report level metrics.
Note: Since report level metrics should generally be first in the join path, it is the user's responsibility when using the "Do not do downward outer join" setting to ensure all report level metrics are first on the template.
For example, consider the following report results. Both use the same attributes and metrics. The only difference is that one places the metrics in the order Revenue, Units, Cost, and the other in the order Cost, Revenue, Units:
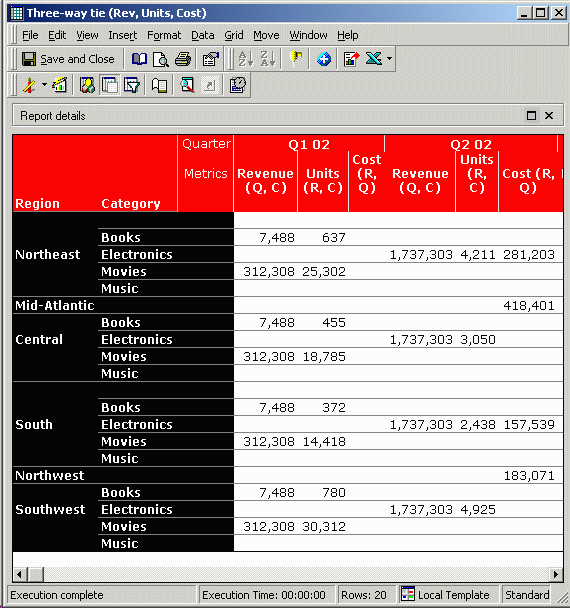
There are no definitive rules for determining the correct metric order. It depends entirely on the nature of the data and, in cases such as the above in which neither order is mathematically preferable, on the results the user expects to see.
How to set the order of metrics for joining in the final pass
In a report definition, metrics are saved in a certain order in the metadata: left to right if the metrics are in the columns, and top to bottom if the metrics are in the rows. While editing a report, it is sufficient to pivot the metrics into the right order.
While viewing report results, the process is slightly different. Pivoting a metric creates a "view" of the "base" report. The view template controls the display, while the base report determines the SQL. If metric pivoting did not create a view template, the report would have to reexecute against the warehouse every time a user moved a metric in a grid view.
When the report is saved, Strategy compares the view template (if it exists) against the base template. If the objects are the same, and there is no view filter, there is no need to save a separate view template. In this case, the base template is modified to match the order of objects in the view template. If there is a view filter or other feature that requires a view to be saved, the new order goes into the view template and the base template is untouched.
To force regeneration of SQL using the new metric order, it is necessary to save the report without the use of OLAP Services features such as the view filter, the report objects panel, or derived metrics. If OLAP Services features are used in the report, the base template will be unchanged after saving and the SQL will be identical the next time the report is executed.
How to reorder metrics for display without reordering them in SQL
The view template means also that report designers may order the metrics for display (the view) differently from the ordering for SQL generation (the base). For example, suppose the first result set above is desired, but users want to see metrics in the order Cost, Revenue, Units. To create this report, perform the following steps.
The next time the report is run, the result set will be the same as the base report, but the display order of the metrics will be as saved:
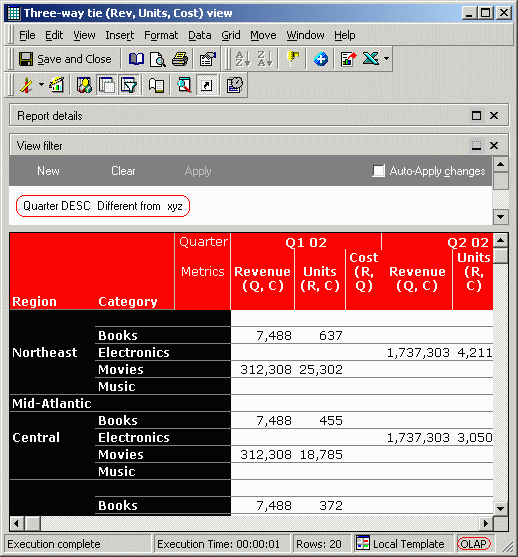
Note: If the view filter is removed, the report will be converted back into a non-OLAP report the next time the report is saved, and the base template will change to match the displayed order. This may alter the report's outcome.
Prompted templates
If users are prompted to select metrics on the template, the template order follows the order of prompts on the template. For example, consider a report with two metric prompts as follows:
If the user chooses A1, A3 and B2, the template will always have A1 and A3 before B2.
Thus, multiple object prompts for metrics can be used to ensure that a certain group of metrics always appears before another group of metrics.
Note: When metric prompts are used on the template, report designers must take the highest precaution to ensure that users will not be able to choose a set of metrics that will break the report. If this possibility exists, the report designers should use the "Do not do downward outer join... and order temp tables and last pass by dimensionality" setting. When using the automatic-ordering setting, there should be at least one report level metric that will always be included in the report. It may be directly on the template, or in an object prompt whose answer is required.
Note: Within each metric prompt, users can control the order of metrics by the order in which they select the metrics. Thus, prompts should group only those metrics that are not sensitive to template order. In general, this means that all metrics in a single object prompt should have the same dimensionality.
Note: The above caveats apply only when the "Do not do downward outer join" setting without automatic ordering is used.
For more details on performing outer joins between metrics at different dimensionalities, refer to the following Strategy Knowledge Base documents: