EducationSoftwareStrategy.com
StrategyCommunity

Knowledge Base

Product

Community

Knowledge Base

TopicsBrowse ArticlesDeveloper Zone

Product

Download SoftwareProduct DocumentationSecurity Hub

Education

Tutorial VideosSolution GalleryEducation courses

Community

GuidelinesGrandmastersEvents
x_social-icon_white.svglinkedin_social-icon_white.svg
Strategy logoCommunity

© Strategy Inc. All Rights Reserved.

LegalTerms of UsePrivacy Policy
  1. Home
  2. Topics

KB483638:Support metric guide for metric defined on attribute or row count metric when the metric is calculated in Blending


Qinyi Chen

Quality Engineer, Principal • Strategy


Before MicroStrategy 2020, if the metric has to be calculated in Data Blending and is defined on an attribute or row count metric, the metric guide is supported for this metric.

Starting with the release of Strategy ONE (March 2024), dossiers are also known as dashboards.

Symptoms

  • Wrong data shown for derived metric defined on attribute or row count metric
  • When examine CSI, a wrong metric guide is used
  • It happens when multiple datasets are used and the derived metric is put on grid with attributes from other dataset

Glossary

  • Metric Guide
  • What is CSI?
  • Query Detail – A way to check SQL and CSI statements.
  • Data Blending – a component of Data Engine that blends data from different datasets
  • Metric Push Down – When the metric can be calculated within its dataset, the Engine will try to push the calculation down to this dataset; when it cannot, for example if it needs to be aggregated or extended to a dimension that doesn't exist in this dataset, the Engine tries to fetch the metric component from the dataset and calculate it on the Data Blending layer, and it cannot be pushed down.

Steps to Reproduce


The following example uses Strategy Tutorial warehouse. 
1.    Open Strategy Web.
2.    Create a new dossier.
3.    Create 2 new datasets in the dossier.
a.    Create the new dataset DS1.
i.    Add External Data > Databases > Type a Query.
ii.    Select Strategy Tutorial as data source and type the following Query (adjust the WHERE clause condition based on the data):


SELECT MNTH_CATEGORY_SLS.MONTH_ID MONTH_ID,
          MNTH_CATEGORY_SLS.CATEGORY_ID CATEGORY_ID,
          MNTH_CATEGORY_SLS.TOT_COST TOT_COST 
FROM   MNTH_CATEGORY_SLS MNTH_CATEGORY_SLS 
WHERE (MNTH_CATEGORY_SLS.MONTH_ID > 201401 and MNTH_CATEGORY_SLS.MONTH_ID < 201406)

It will return data for 4 months in 2014.
iii.    Prepare Data > Add a new table > Databases > Type a Query.
iv.    Select Strategy Tutorial as data source and type the following Query:

SELECT MNTH_CATEGORY_SLS.MONTH_ID MONTH_ID,
          MNTH_CATEGORY_SLS.CATEGORY_ID CATEGORY_ID,
          MNTH_CATEGORY_SLS.TOT_DOLLAR_SALES TOT_DOLLAR_SALES 
FROM   MNTH_CATEGORY_SLS MNTH_CATEGORY_SLS 
WHERE (MNTH_CATEGORY_SLS.MONTH_ID > 201501 and MNTH_CATEGORY_SLS.MONTH_ID < 201512)

It will return data for 10 months from 2015.
v.    Click “Add” to enter the Preview window.
vi.    Rename the first table “MNTH_CAT_SLS_2014” and the second table “MNTH_CAT_SLS_2015”.
vii.    Click “Finish” and Import as an In-memory Dataset.

ka0PW0000001Ji2YAE_0EM2R000000m3pd.jpeg

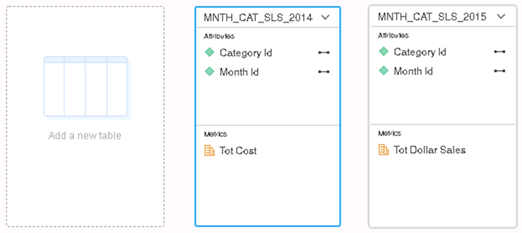
b.    Create the new dataset DS2.
i.    Add External Data > Databases > Select Tables.
ii.    Select Strategy Tutorial as data source and choose table “LU_MONTH”.
iii.    Click “Prepare Data” to enter the Preview window.
iv.    Open the table menu and click “Define Relationships”.
v.    Add 2 new relationships as follow:

ka0PW0000001Ji2YAE_0EM2R000000m3qH.jpeg

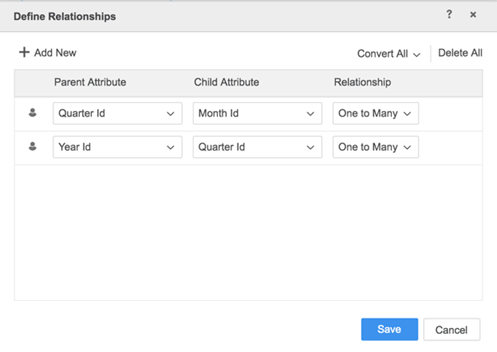
vi.    Save the relationship and the dataset. Import as an In-memory Dataset.
4.    Right click on attribute “Month Id” in DS1, click “Link to Other Dataset…” and link it to the attribute “Month Id” in DS2.
5.    In DS1, create a new derived metric.
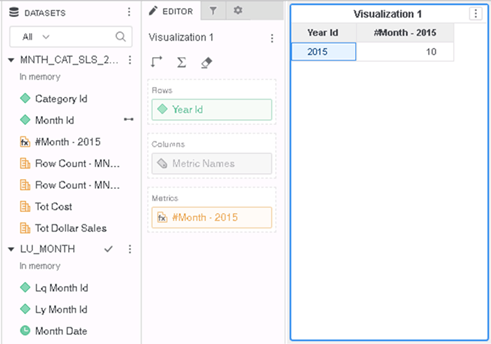
a.    Rename the derived metric “#month - 2015”.
b.    Type the following formula in formula section:


Count<Distinct=True, MetricID=[Row Count - MNTH_CAT_SLS_2015]>([Month Id]@ID){~+}

This formula will create a metric of Count(Month Id) and in its Count Parameters, "Include Distinct Elements" will be set to True and Metric Guide will be set to [Row Count - MNTH_CAT_SLS_2015].
c.    Validate the formula and save the metric.
6.    Add attribute “Year Id” in DS2 and derived metric “#month – 2015” in DS1 to the visualization.
7.    The attribute and metric displayed the value of count of months in DS1 in year 2014 instead of 2015.

ka0PW0000001Ji2YAE_0EM2R000000m3qR.jpeg

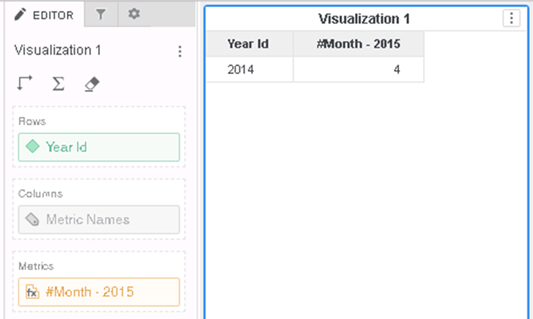
Remember that 10 month of data are imported from 2015, so we should expect this metric to show 10, and the Year Id to show only 2015.
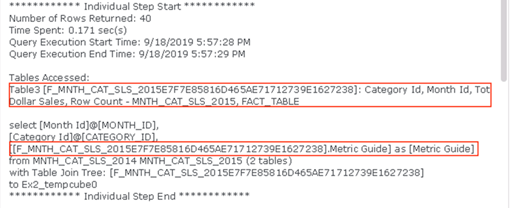
8.    Open the visualization menu and check the Query Detail, note that it picks table MNTH_CAT_SLS_2014 to get the elements of Month Id instead of the one indicated in the Metric Guide which is MNTH_CAT_SLS_2015.

ka0PW0000001Ji2YAE_0EM2R000000m3qW.jpeg

Cause


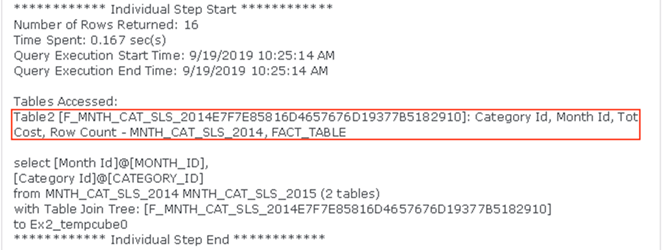
Before Strategy 2020, the Engine does not support Metric Guide for metrics that meets both criteria:
1) the metric is defined on an attribute or a Row Count Metric
2) the metric cannot be pushed down to calculate in the dataset, so it will have to be calculated in Data Blending
When it is not supported, Data Blending sometimes retrieve wrong attributes and generates CSI using these attributes.

Solution


To resolve this defect, please upgrade to Strategy 2020 or above, and set Data Engine Version setting to 12.
The project level setting Data Engine Version can only be enabled through Workstation. For more details on enabling the setting, see Change Data Engine Version . 
In Strategy 2020, the metric guide is supported and will guide the Engine to retrieve the metric from the  correct table.

ka0PW0000001Ji2YAE_0EM2R000000m3ql.jpeg

In the Query Detail, the Engine is guided by the metric guide and pick the correct table.

ka0PW0000001Ji2YAE_0EM2R000000m3qq.jpeg

Strategy Internal Reference number for this technical note is KB483638 and US144497.


Comment

0 comments

Details

Knowledge Article

Published:

September 19, 2019

Last Updated:

March 21, 2024