EducationSoftwareStrategy.com
StrategyCommunity

Knowledge Base

Product

Community

Knowledge Base

TopicsBrowse ArticlesDeveloper Zone

Product

Download SoftwareProduct DocumentationSecurity Hub

Education

Tutorial VideosSolution GalleryEducation courses

Community

GuidelinesGrandmastersEvents
x_social-icon_white.svglinkedin_social-icon_white.svg
Strategy logoCommunity

© Strategy Inc. All Rights Reserved.

LegalTerms of UsePrivacy Policy
  1. Home
  2. Topics
  3. KB81670: Creating visual representation of data using the Line Chart

KB81670: Creating visual representation of data using the Line Chart


Nida Imtiaz

Product Manager, Senior • Strategy


This article illustrates some quick facts about line charts. You can even download the dossier to view it in MicroStrategy Desktop.

Starting with the release of Strategy ONE (March 2024), dossiers are also known as dashboards.
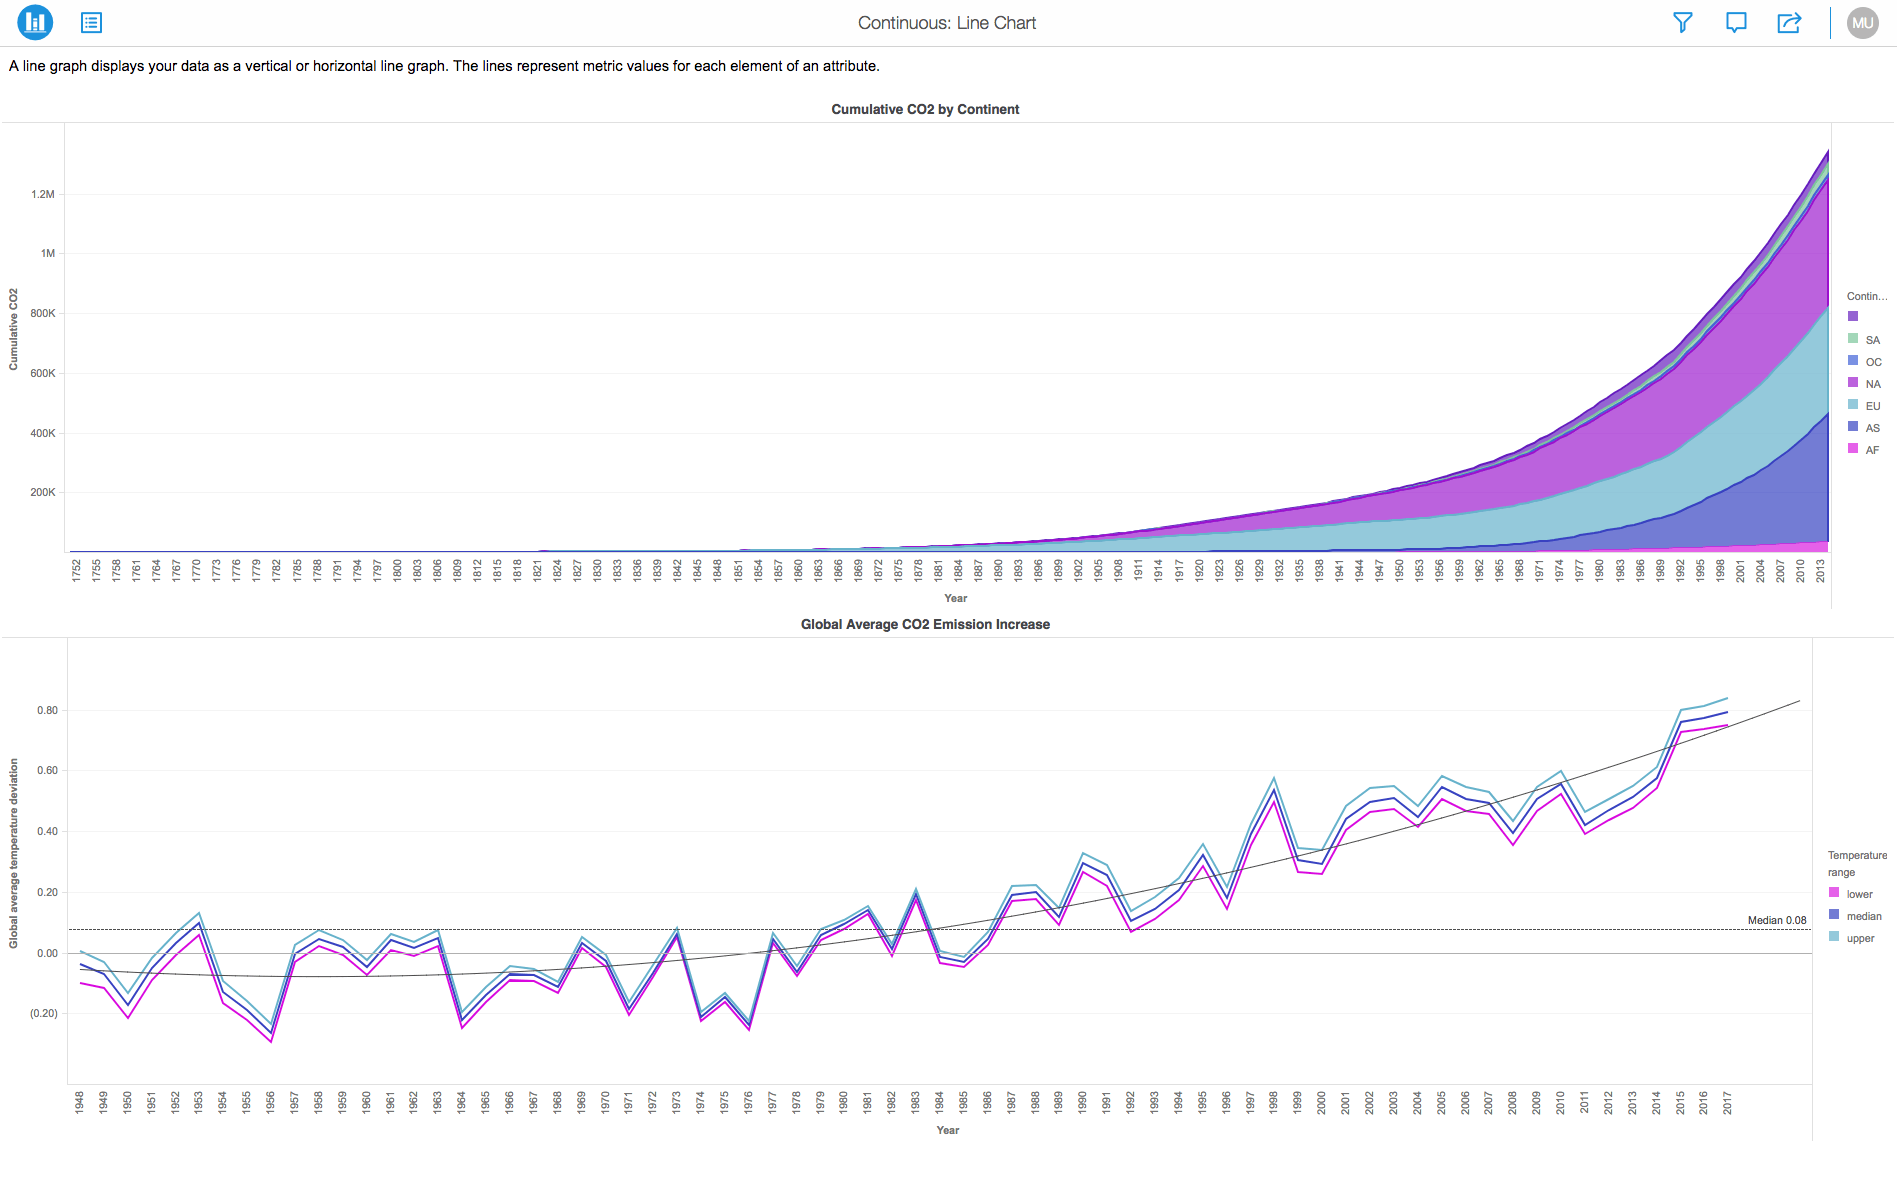
A line chart or line graph is a type of chart which displays information as a series of data points called 'markers' connected by straight line segments. It is a basic type of chart common in many fields. Line charts are most often used to visualize data that changes over time.
 
If you have a line chart, you can change the look of the data markers to make them easier to distinguish. Some are articles, that talk about these data markers:
 

  1. Line Chart: Square
  2. Line Chart: Circle
  3. Line Chart: Ring

 
It displays information as a series of data points called ‘markers’ connected by straight line segments.
 
It is similar to a scatter plot except that the measurement points are ordered (typically by their x-axis value) and joined with straight line segments. Line Charts show how a particular data changes at equal intervals of time.

ka0PW0000001JmiYAE_0EM44000000Q9fg.png

Requirements:

  • Attributes: 1 or more
  • Metrics: 1 or more

Minimum Strategy version: 10.9
Publisher: Strategy 
Installation Instructions:

  • Attached to this article is a Dossier (.mstr) that contains a demo of the Line Chart in action.
  • To view this dossier with the visualization, download the .mstr file attached and deploy it in Strategy Web.
  • To open the demo visualization in Strategy Web, navigate to Strategy Web and click the "Upload Strategy file" option to upload the file .mstr file.

References:
1. A project in beta by ferdio, (2017, December 4th). Retrieved from http://datavizproject.com/
2. Line Charts, Wikipedia. Retrieved from https://en.wikipedia.org/wiki/Line_chart


Comment

0 comments

Details

Example

Published:

December 4, 2017

Last Updated:

March 21, 2024