Starting with the release of Strategy ONE (March 2024), dossiers are also known as dashboards.
New Features & Functionality
New Strategy Geospatial Services Introduced in 10.11
Strategy 10.11 introduces Geospatial Services and delivers new mapping capabilities powered by native integration with Mapbox. The enhanced mapping capability is available for dossiers on all interfaces, including Strategy Desktop, Workstation, Web, and Library (Mobile included). With Geospatial Services, Strategy now offers advanced geospatial analytics features that allow users to get more out of their location data. This new map visualization is available in addition to out-of-the-box ESRI maps.
The new vector-based mapping option, powered by Mapbox, doubles the functionality of existing out-of-the-box ESRI maps. Vector maps are an advanced approach to mapping where features are rendered faster and smoother, providing an exceptional user experience. Users can rotate or tilt maps and zoom in or out more fluidly than before. Icons and labels adjust automatically depending on zoom levels, offering clarity from any angle.
Strategy will offer two mapping options in the Visualization Gallery: Maps with ESRI (which is available out-of-the box with the Server) and the new Geospatial Services with Mapbox, which will be available as an add-on service for the Server. Both ESRI and Geospatial Services will be available out-of-the-box with Desktop and Workstation.
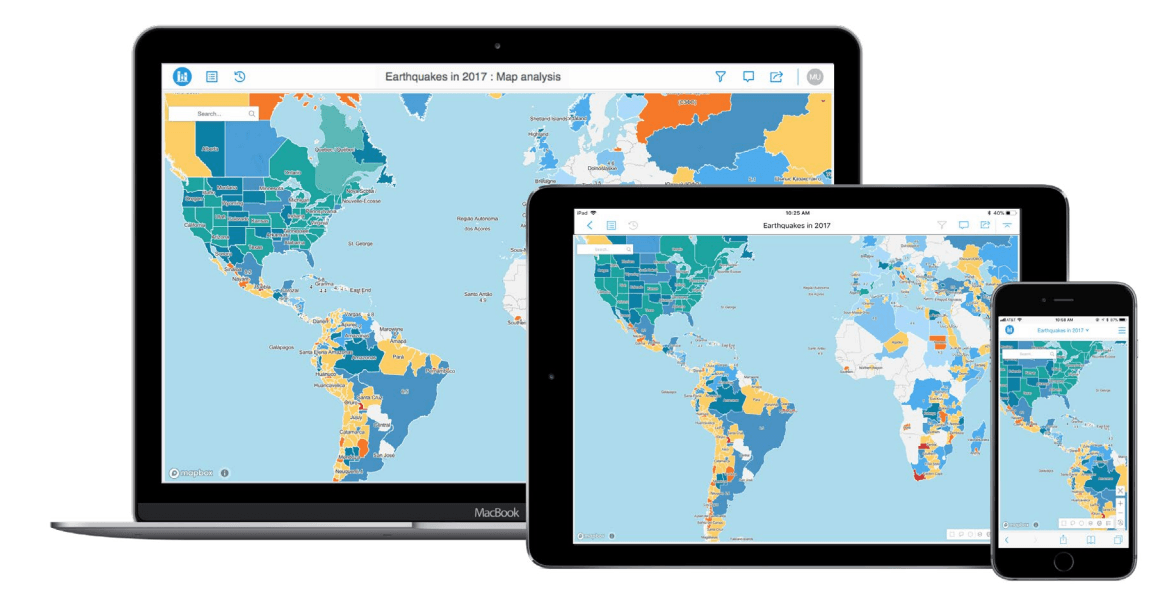
Polygon shapes for every zip or postal code and for all countries
With Strategy 10.11, users can leverage Geospatial Services to plot polygons on a map with global coverage down to the zip code or postal code level. Polygon shapes for maps are available for:
• More than 150 countries
• All states (US and international)
• Zip or postal codes (US and international)
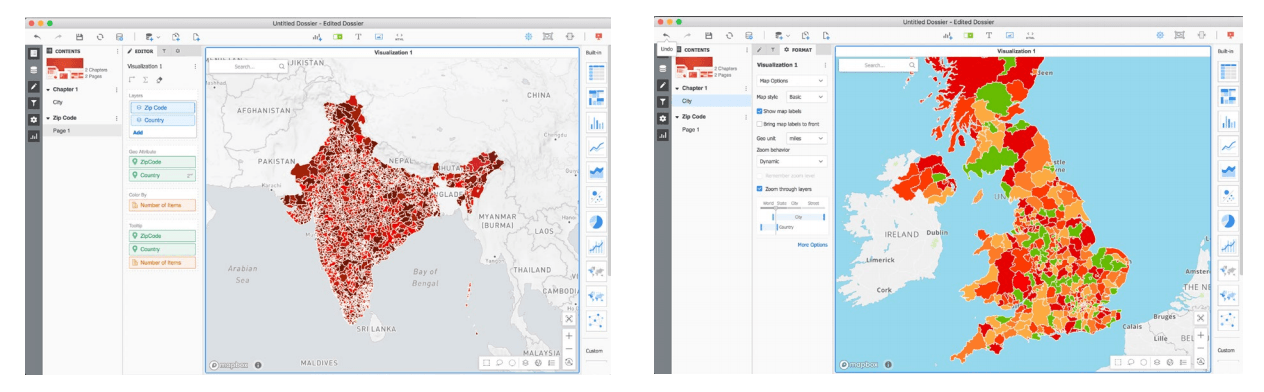
Additionally, by adding a secondary geo-attribute, it is possible to easily resolve conflicts where multiple locations have identical names. If a dataset contains information for both Paris, TX, USA and Paris, France, users can easily resolve which data point is in France and which one is in the US. This feature is currently only available for area maps.
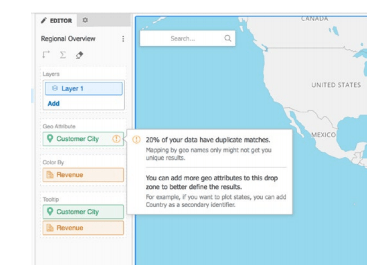
Multiple map styles for geospatial data
With the new Geospatial Services, users have multiple options for map styles. Users can select from the following style options: Basic, White, Light, Dark, Street, Topographic, Physical, Relief, Satellite and Satellite Street styles.
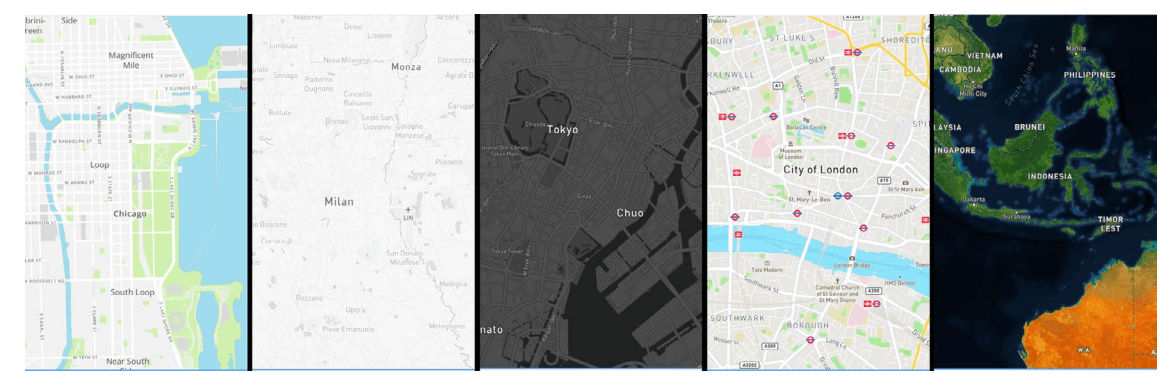
Enhanced mapping interactivity
Mapping with Geospatial Services is based on vector maps, ensuring faster performance and response times, even with large datasets. Analysts and consumers benefit from both added functionality and faster performance with the new map integration.
Interactivity options include:
• Options to zoom in or out and to automatically drill into data at a more granular level in any location around the world
• Multiple data selection options to highlight and select specific or multiple data points using rectangular, lasso, and circular selection tools (that allow you to change the unit from miles to kilometers)
• The ability to display tooltips with supplementary information
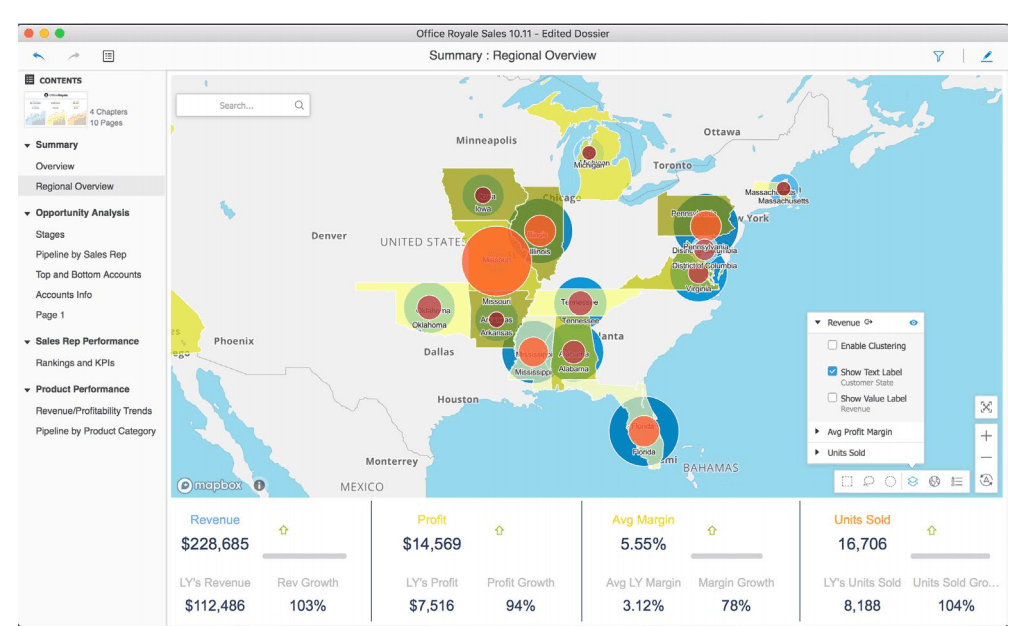
• The ability to layer and display multiple metrics on the same map in which each layer can leverage different graphic types, including markers, bubbles, and area charts. Users can easily toggle each of these layers and modify the order of the layers. It is also possible to hide or display layers on the map. Clusters and data labels can also be controlled at the at the layer level
• The ability to tilt and rotate the map to view different angles and find new perspectives
• Reset the map zoom with a reset button to reveal all the data points
More control when aggregating data into clusters
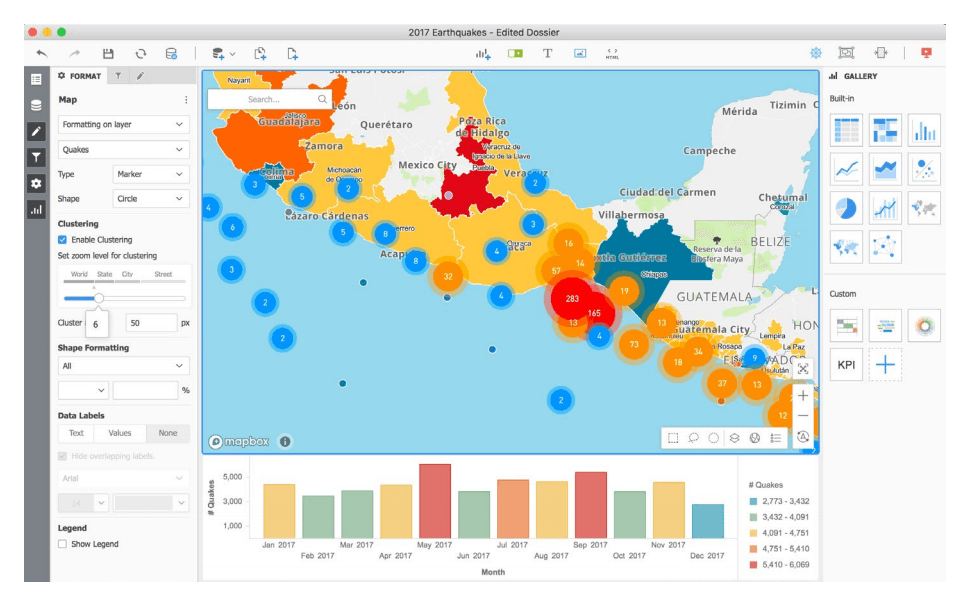
Users can now enable and disable clustering for data points on a map with more control. The screen below shows the formatting properties panel that allows authors to dynamically control zoom levels for clusters.
Dynamic display of layers based on zoom levels
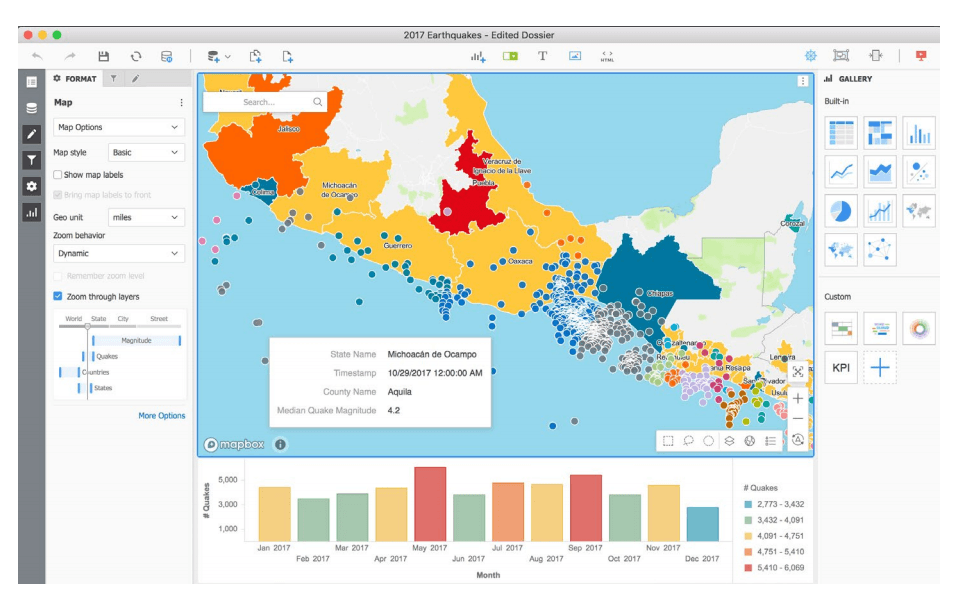
With the new Geospatial Services, analysts can opt to display specified data layers at different zoom levels. This allows analysts to create maps that do not look cluttered with too many data points and only show data that is relevant to the zoom level. For example, as the user zooms in, he or she can see more granular levels of information that is not displayed when the map is zoomed out.
Color maps by attributes
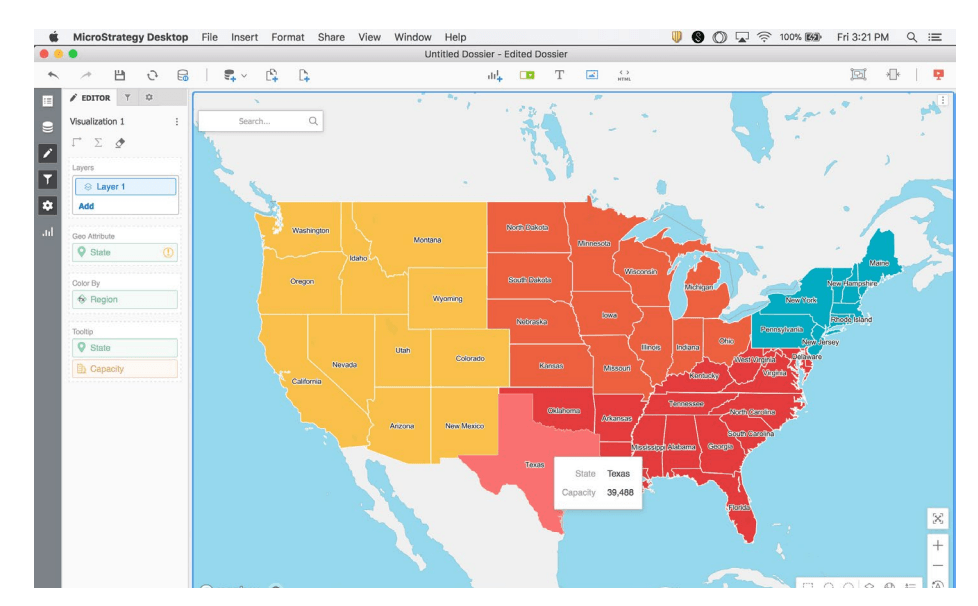
With 10.11, authors can add color thresholds to attributes or dimensions, which was previously only available with metrics. With the new Geospatial Services, users can visually differentiate business dimensions on a map.
For Administrators, read this article on Connection requirements and the flow of data for using Strategy Geospatial Services.
For Analysts, check out these video tutorials on using Strategy's advanced mapping visualization.
