Starting with the release of Strategy ONE (March 2024), dossiers are also known as dashboards.
Explore some of the FAQs regarding mapping in Strategy!
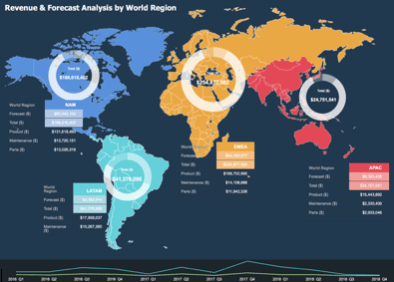
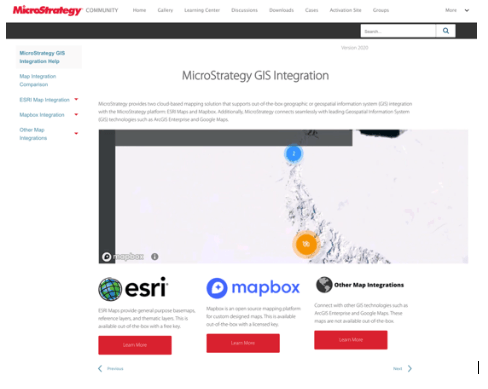
Mapbox is our premium mapping solution with high-performance zooming and advanced clustering. Mapbox also offers threshold formatting by attributes and global coverage down to the zip code level. And with 2020, users can now add custom shapes in dossier through the data import workflow.
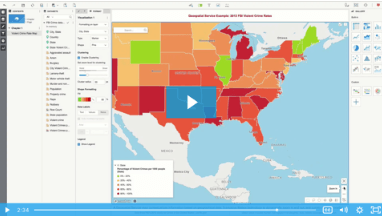
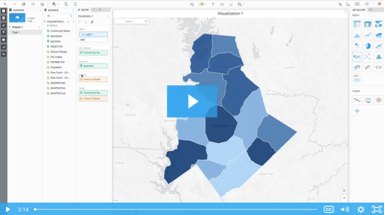
Strategy Geospatial Services is our premium, modern mapping offering that is powered by Mapbox. Strategy takes advantage of key Mapbox features that enable dossier authors to create beautiful and performant visualizations. Some key benefits include:
Mapbox is our more modern mapping offering that has larger global coverage and better performance. For more information on when to use Mapbox versus ESRI, read this Community article written by the Product Management team. Our product documentation also has a comparison table in our Geospatial Help.
No, Strategy is planning on supporting ESRI and Mapbox and currently has no end of life plans for either partnership.
As noted in the comparison table in our Geospatial Help, pie chart is only available in ESRI; bubble is available in both. Use free-form layout to layer visualizations with your map for additional context.
You have control over what you display in Mapbox tooltips. For ESRI tooltips, the items displayed on the tooltip are based on the Geo-attribute and any metric in your color by drop zone; you also cannot change the order.
Follow along with our documentation:
Note: Currently, we only support longitude and latitude coordinates (WGS 1984) in custom shapes. As a result, you need to convert the projection from Web Mecator to WGS1984 to show the polygon.
Yes, KML files can be saved as a dataset, and the dataset is reusable among multiple dossiers.
ESRI map supports KML and SHP, while Mapbox supports KML and GeoJSON. There is no significant performance difference. Use whichever format you prefer.
Refer to data flow models in these articles:
We currently support on-prem with ESRI, and not Mapbox.
Starting with Strategy Analytics Enterprise 9.4.1 Hotfix 6 and in Strategy 10.X, users are able to configure Strategy Web to send HTTP request to ESRI via internal proxy servers. Follow the steps in this Community article.
We do not currently support Mapbox Studio with our OOTB Mapbox implementation. We have 10 OOTB styles that we recommend customers use. These styles were created by Mapbox’s team of cartographers, and refined by Strategy’s design team, including dark/light modes to make your data pop, outdoors to show terrain, streets, and more. These styles use Mapbox’s Streets Tileset that pull from many data sources from proprietary Mapbox data to Open Data projects such as OpenStreetMap, as well as data vendors such as Zenrin in Japan, PSMA in Australia and Visicom in the UAE. (article)
Can we integrate layers from ArcGIS Online to Strategy?
Yes, integrate the custom ESRI webmap with Strategy by adding the webmap ID in
mapConfig.xml.
<webmaps>
<webmap id="customer webmap ID" default="true"/>
</webmaps>
Strategy allows you to join multiple data sets together using its built-in data preparation and wrangling capabilities. To create a join between your spatial and non-spatial data you must have a common key field between the data e.g. community_id, postal code, city name etc.
To display areas in a map or geospatial service visualization, you must provide an attribute whose values include the names of each area in the base map. The base map contains the shape (or boundaries) of each area that can be displayed in the visualization.
The boundaries available include the following for geospatial service visualizations:
The boundaries available include the following for ESRI map visualizations:
Refer to our official documentation for more information.
Tip: Use custom shapes to plot areas unique to your business.
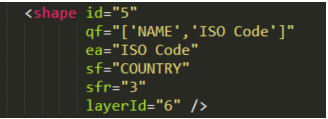
Yes, modify the with id="5" in the esriConfig.xml under Strategy/WEB-INF/xml/config/ by changing ea to "ISO Code" and add "ISO Code" to the qf array as seen below and restart the webserver. For more information, read the documentation here.
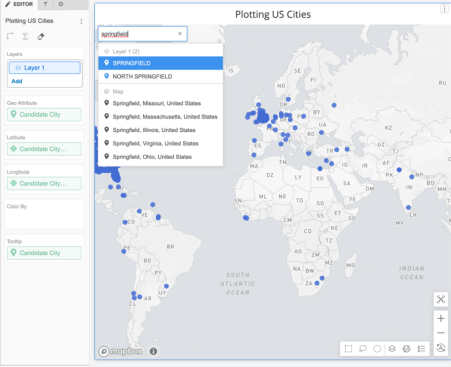
For example, I have a dataset that only has some US Cities but without adding a secondary attribute like state, Mapbox will plot city names wherever they exist in the World. If I search “Springfield” I can see it exists in many places.
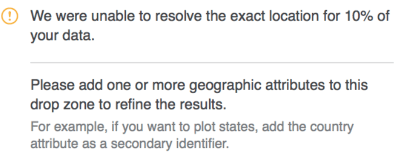
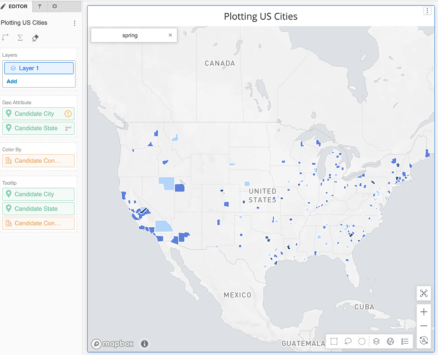
To add a secondary attribute, switch from Marker to Area map and then drag-and-drop your secondary geo-attribute to the drop zone. Now I can see the map is only plotting the areas where I have data and want to display and conduct my analysis on.
To add a secondary geo-attribute for ESRI, define the geography for the attribute. In this case, right-mouse-click on Pais and Define Geography as country.
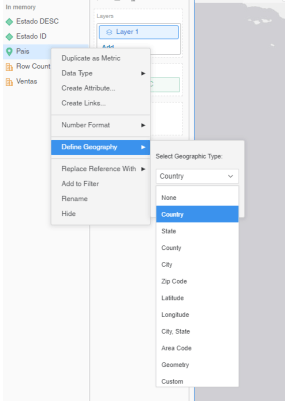
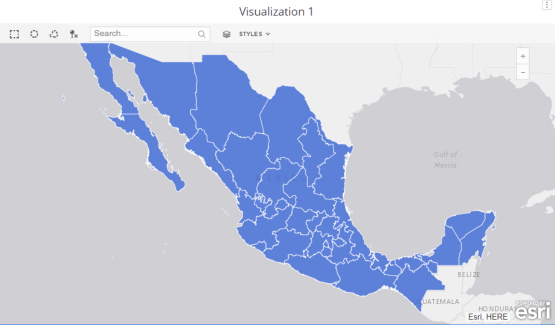
Then, add Pais to the Tooltip drop zone. Then only Mexican states will display.
Mapbox supports 6-digit latitude and longitude, which is 0.1m resolution. For example, Washington DC has a latitude 38.8951 and longitude -77.0364.
To learn more about decimal degrees, check out this page on Wiki GIS.
In Canada, MapBox supports forward sorting area (FSA first 3 digits) and not local delivery unit (LDU, last 3 digits). ESRI does not support any international post codes OOTB (see doc).
Using custom shape files, you can render the 6-digit Canadian postal codes in both ESRI and Mapbox.
You have a few options!